

If you teach weather at almost any grade level, www.wunderground.com, the Weather Underground website is a great source for weather data and for looking at how data can be displayed.
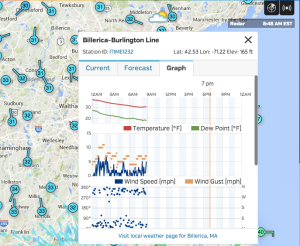
Wunderground collects and displays data from over 37,000 personal weather stations, including one at our own Burlington High School, to bring you a real time weather map. The interactive “wundermaps” show you where data is being collected. Click on a weather station to see more detailed information about current, past, and forecast weather conditions.
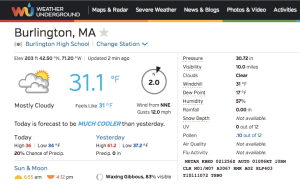
Data is provided in a variety of ways from the very simple “Today is forecast to be MUCH COOLER than yesterday” to the far more complex, including astronomical, air quality/pollutant, and almanac information.
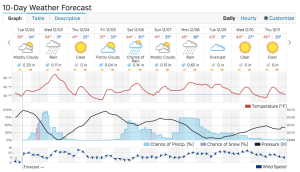
If your focus is on comparing different ways of presenting the same data, the 10-day weather forecast is displayed as a graph, a table, or a series of descriptions. Despite the exceptionally large amount of information given on this website, it is structured so that it is easy to read and with clear, eye-catching, graphics.
For the majority of site’s functions, there’s no need to join the Wunderground Community. However, with a free membership you can start your own weather blog or comment on someone else’s, get weather alerts or share your own weather webcam.
 Through the Personal Weather Station Project, your school or class can purchase weather station hardware and software and contribute to the wunderground community by streaming your weather conditions. A $10 per year membership fee will increase some options such as the number of screens per radar map and will allow you to go ad-free.

